
Lessons learned from perfusate analysis during dual hypothermic oxygenated machine perfusion of liver grafts
Damiano Patrono1, Giorgia Catalano1, Giorgia Rizza1, Nicola Lavorato1, Paola Berchialla2, Paola Caropreso3, Giulio Mengozzi3, Renato Romagnoli1.
1General Surgery 2U - Liver Transplant Unit, AOU Città della Salute e della Scienza di Torino, Turin, Italy; 2Department of Clinical and Biological Sciences, University of Turin, Turin, Italy; 3Clinical Biochemistry Laboratory, AOU Città della Salute e della Scienza di Torino, Turin, Italy
Background: Liver graft viability assessment has long been considered a limit of hypothermic oxygenated machine perfusion (HOPE). Aim of this study was assessing correlations of easily available perfusate parameters (PP) (AST, ALT, LDH, glucose, lactate and pH) with graft features and outcome.
Methods: In the period October 2018 – January 2020, perfusate samples were obtained every 30’ during 50 dual-HOPE (D-HOPE) procedures. Correlations of PP with graft factors, 90-day graft loss, early allograft dysfunction (EAD), L-GrAFT score, acute kidney injury (AKI) and comprehensive complication index (CCI) were analyzed using Pearson coefficient, receiver operating characteristics (ROC) analysis and by univariable and multivariable regression.
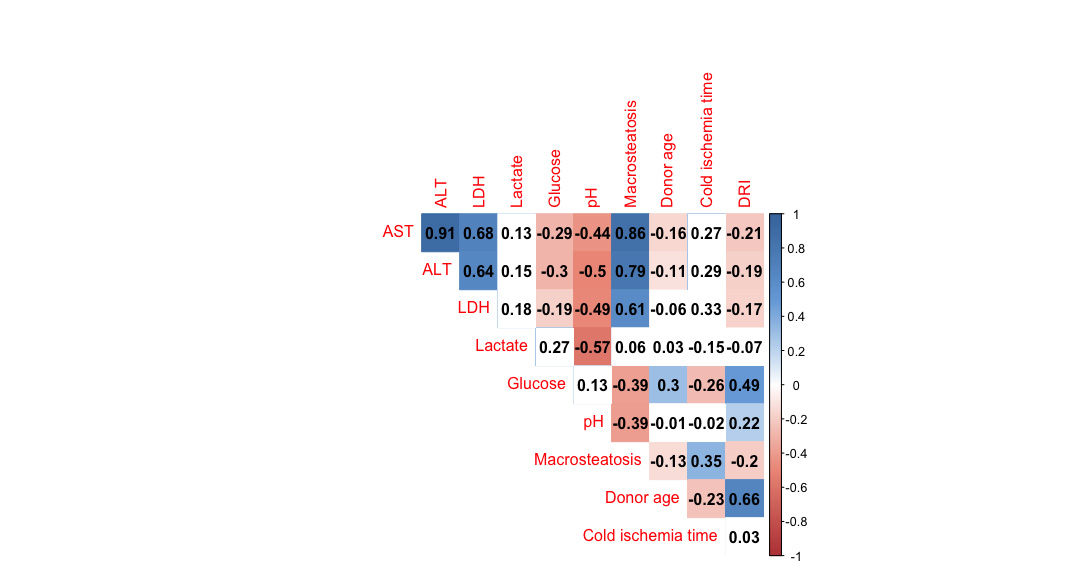
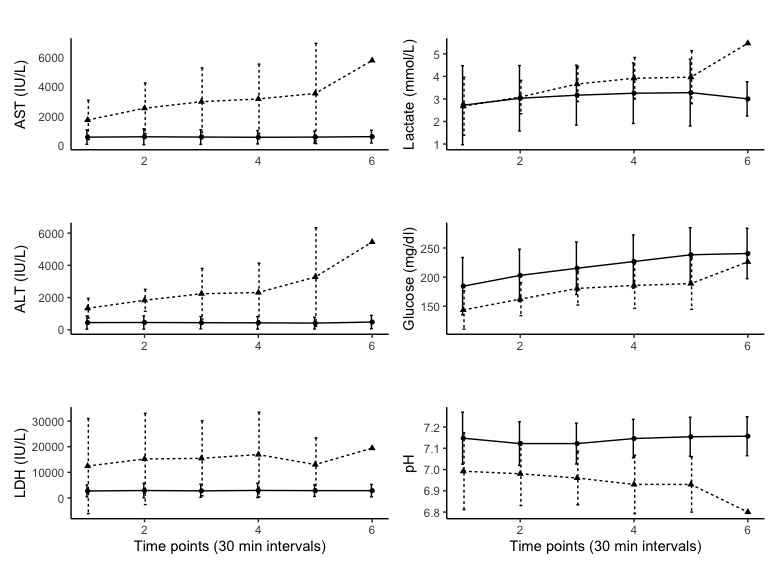
Results: Median D-HOPE time was 125 minutes. All parameters were normalized to liver weight. Only macrovesicular steatosis (MaS) significantly impacted PP levels and slope (Figure 1).
Grafts with ≥30% MaS exhibited different PP values and slope (e.g. 90-min ALT 311 versus 1800 IU/L, p=0.001) (Figure 2).
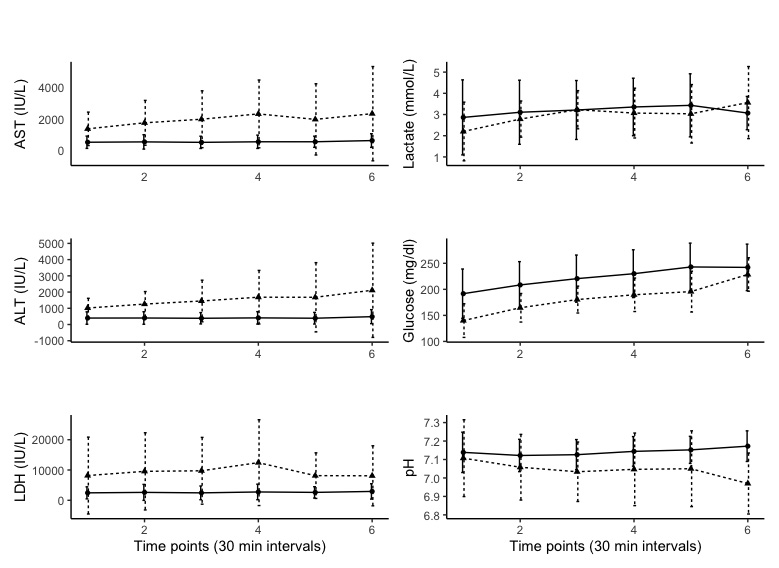
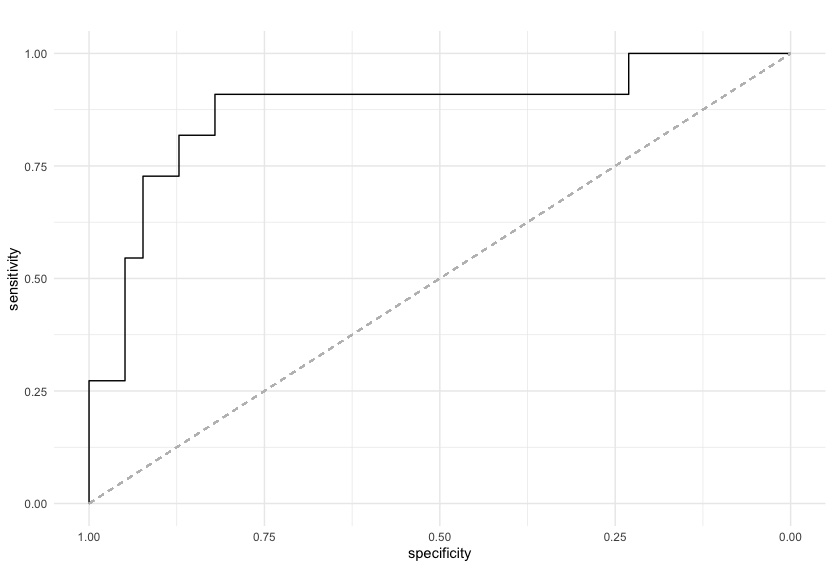
Graft loss and EAD rate were 2% (n=1) and 22% (n=11). All PP except lactate correlated with EAD (Figure 3), 90-min ALT showing the highest area under the ROC curve (0.86) (Figure 4).
However, at multivariable analysis, the only factor independently associated with EAD was MaS (odds ratio: 17.82, confidence interval: 1.79 - 177.45, p = 0.01). 90-min LDH had the strongest correlation with L-GrAFT (R=0.71, p<0.001). PP correlated poorly with CCI and grade 2-3 AKI rate.
Conclusions: PP were predictive of post-LT graft function after transplant, but association with graft survival and clinical outcomes requires further evaluation. MaS influenced levels of PP and was the only independent predictor of EAD.
There are no comments yet...